
Category: Finance

  • College vs Trade School in 2026: Which One Actually Pays Off?

    College vs Trade School in 2026: Which One Actually Pays Off?

    College vs trade school is the question a lot of families are quietly rethinking in 2026 — and it’s not the slam-dunk it used to be. For decades, “go to college” was the default advice. But tuition keeps climbing, student debt just crossed a new record, and for the first time in modern history, young college grads are having a harder time finding work than the country as a whole. Meanwhile, the trades are short-staffed, apprentices get paid to train instead of paying to train, and skilled workers are aging out faster than new ones are coming in. So which path actually leaves you better off? Let’s walk through the real numbers, side by side, so you can decide for your own situation — not someone else’s.

    College vs Trade School: Quick Answer

    • If you want the highest long-run earnings ceiling, plan to work in a field that legally requires a degree (medicine, law, engineering, teaching), or you’re aiming for corporate/management roles → college is still usually worth it.
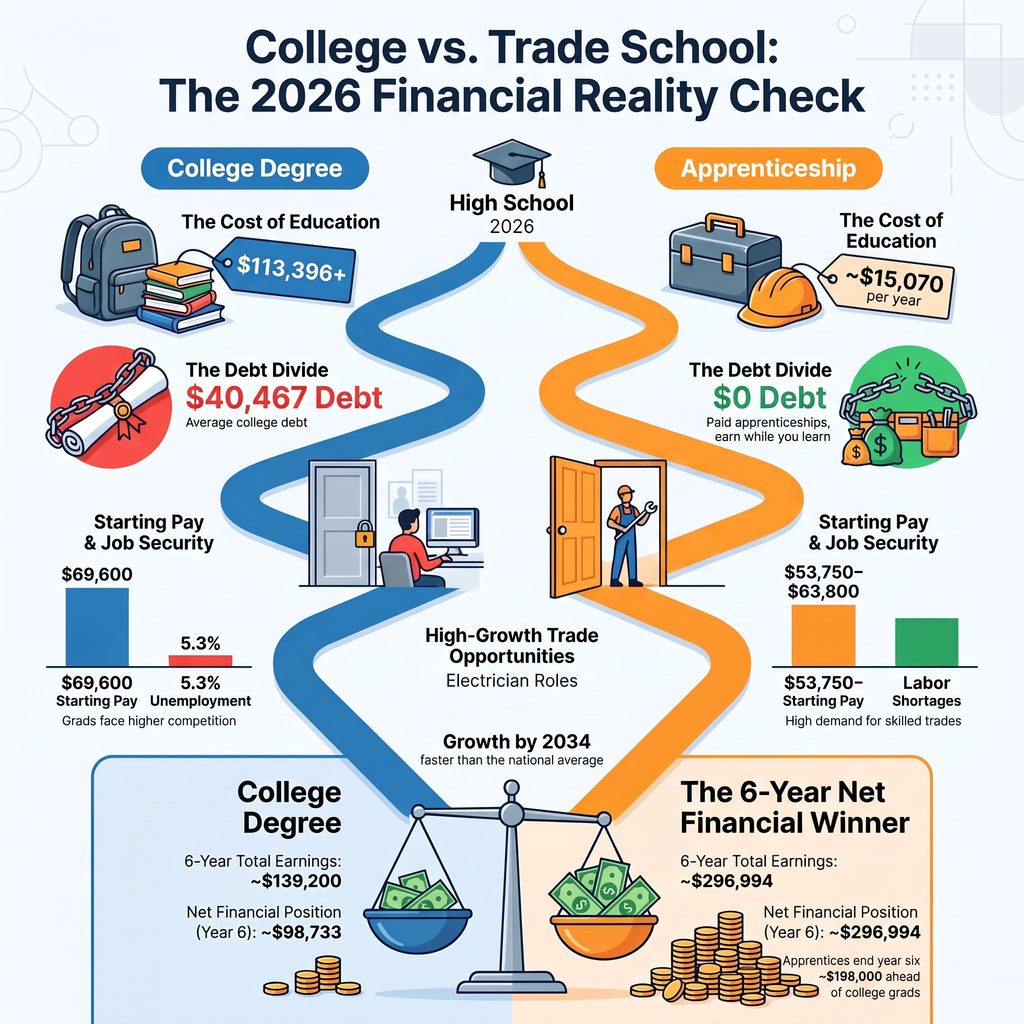
    College vs trade school 2026 cost, debt and earnings comparison infographic
    • If you want to start earning fast, avoid debt, and enjoy hands-on work that can’t be outsourced or automated → trade school (especially a paid apprenticeship) comes out ahead, often by a lot, in the first several years.
    • For most 18-to-22-year-olds who aren’t set on a degree-required career → the trades now offer the faster, cheaper, lower-risk path to a solid income — while a degree remains the better bet only if you actually need it for the job you want.

    College vs Trade School: At a Glance (2026, U.S.)

    College (4-year degree)Trade School / Apprenticeship
    Typical time to first paycheck4+ years (only 44% finish in 4 years)1–2 years (certificate) or paid from day one (apprenticeship)
    Average total cost$113,396 (public, in-state) to $243,696 (private)$15,070/year average; often $0 out-of-pocket via a paid apprenticeship
    Average debt carried$40,467 per borrowerTypically $0 (apprenticeships), or a few thousand for a paid certificate program
    Average starting pay$69,600 (2025 grads)$28,400–$34,754 first-year apprentice; $53,750–$63,800 once certified/journeyman
    Unemployment rate5.3% for young grads (age 22–27) — higher than the national rateSkilled trades are broadly labor-short, not job-short
    Job growth outlookVaries widely by majorElectricians: ~9% growth by 2034, faster than average

    The Cost Side: What Each Path Actually Takes Out of Your Pocket

    Here’s the part nobody enjoys but everyone should look at honestly. A four-year degree at a public, in-state school now runs about $113,396 all-in — tuition, fees, room, board, the works, per the College Board’s own pricing data — and that’s if you finish in four years, which only 44% of students actually do. Push it to the more realistic six-year timeline (97.3% finish by then) and the number climbs toward $236,000. Go private, and you’re looking at roughly $243,696 for the same degree.

    Most families don’t pay that in cash. The average student loan borrower now carries $40,467 in debt, and across the country that adds up to a jaw-dropping $1.863 trillion owed by 42.6 million people — a debt load that follows you around for years after graduation, often into your 30s. It’s the same kind of big-money, run-the-real-numbers decision we broke down in our rent vs buy comparison: a bigger commitment of cash today for a payoff that only shows up years later, if it shows up at all.

    Trade school flips the script. The average trade or vocational program costs about $15,070 a year (community-college routes run closer to $8,730), and most programs wrap up in one to two years, not four. But the real headline is the apprenticeship route: in a registered apprenticeship, an employer or union trains you on the job and pays you a wage while you learn — no tuition bill at all. You’re earning from week one instead of borrowing from week one.

    Time to Your First Real Paycheck

    This is where the trades pull ahead fastest. A college student typically earns nothing for four straight years while the meter runs on tuition, rent and living costs. A trade-school student can be certified and working within 12 to 24 months. An apprentice starts even sooner — you’re on a job site and getting a paycheck almost immediately, just at a training wage.

    Think of it like two people leaving the same starting line: one spends four years with their income at zero while their debt grows, and the other spends those same four years with their income climbing every year and their debt at zero. That gap compounds, and it’s the whole reason the numbers below look the way they do.

    What You Actually Earn Once You’re Working

    A college degree still opens the door to a higher average starting number: $69,600 for the class of 2025, though that swings widely by major — engineering grads start around $77,500, while many humanities majors start closer to $68,500 (and plenty of majors sit well below that).

    The trades don’t lag as far behind as people assume. Once certified, median pay lands at $63,800 for plumbers, $63,190 for electricians, $61,010 for HVAC technicians, and $53,750 for welders — and that’s before overtime, union scale, or running your own shop, all of which push experienced tradespeople well into six figures. During an apprenticeship, first-year pay typically runs 40–50% of the full journeyman rate (around $28,400 a year for an electrician apprentice), climbing to 85–95% by the final year — so the wage grows steadily every year you’re training, unlike a college student’s wage, which is zero until graduation.

    Job Security: A Reversal Worth Knowing About

    For most of modern history, a college degree meant lower unemployment than average. That’s flipped. As of March 2026, young college graduates (ages 22–27) face a 5.3% unemployment rate, compared to a 4.3% national average — the first time in decades that recent grads are doing worse than the overall labor market, largely due to a tougher entry-level white-collar hiring environment.

    The skilled trades are dealing with the opposite problem: not enough workers. Hundreds of thousands of trade positions sit unfilled as experienced tradespeople retire faster than new ones are trained, and the Bureau of Labor Statistics projects electrician jobs alone to grow roughly 9% by 2034 — faster than the average occupation. Work that requires hands-on, in-person skill (wiring a house, fixing a furnace, running plumbing) also isn’t something you can outsource overseas or hand to a chatbot, which is quietly becoming part of the trades’ appeal.

    The Original Angle: The Real 6-Year Money Snapshot

    Sticker prices and starting salaries only tell half the story. Here’s a calculation most “college vs trade school” articles skip: where does each path actually leave you financially after six years?

    The setup: We’re comparing a public in-state college grad (4 years earning $0, then 2 years working at the average starting salary) against an electrician apprentice (a 4-year paid apprenticeship with wages rising from 45% to 90% of journeyman pay, then 2 years working at the journeyman median). Same six-year window, two very different paths.

    College GradElectrician Apprentice
    Year 1–4 earnings$0 (full-time student)$28,436 → $37,914 → $47,393 → $56,871 (rising apprentice wages)
    Year 5–6 earnings$69,600 × 2 = $139,200$63,190 × 2 = $126,380
    Total earned over 6 years~$139,200~$296,994
    Debt/tuition owed~$40,467 (average)~$0 (apprenticeship is paid, not billed)
    Net financial position at Year 6≈ $98,733≈ $296,994

    Under this model, the apprentice comes out roughly $198,000 ahead of the college grad by year six — almost entirely because of the four years of real wages the apprentice earns while the college student’s income sits at zero.
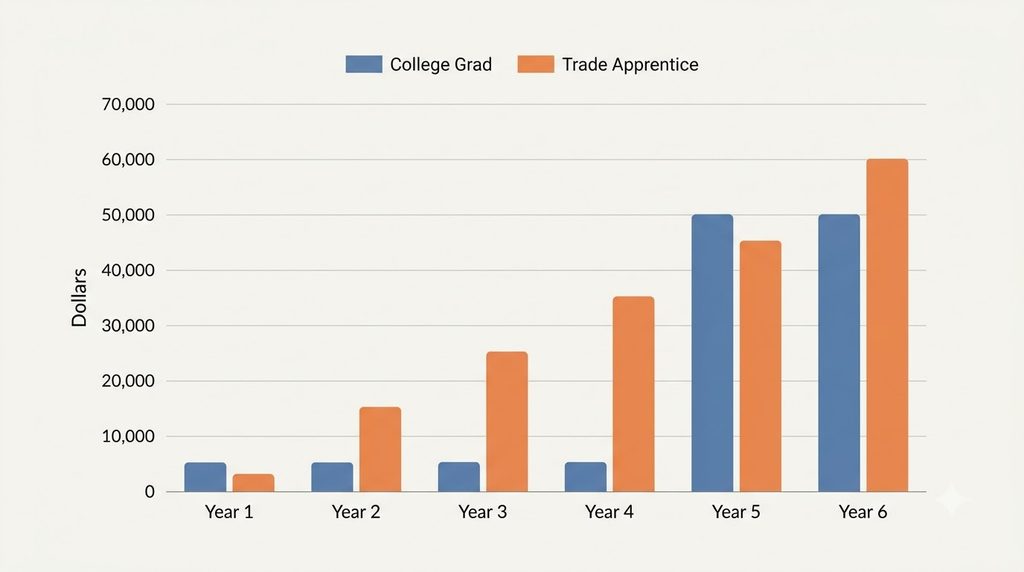
    Chart comparing college grad and trade apprentice earnings over 6 years

    That gap doesn’t mean college is a bad investment; it means the break-even point for a degree is much further out than most people assume, and it depends heavily on landing a job in a field where that degree actually pays a premium.

    (This is our own simplified model, not a prediction — it ignores raises beyond what’s shown, cost-of-living differences, the possibility of scholarships or employer tuition help, and the fact that some college majors out-earn the trades by a wide margin over a full career. Run your own numbers based on your intended major or trade.)

    Which One Actually Fits You?

    Money isn’t the only variable, so let’s be honest about the rest of it. College tends to suit you better if you already know you want a career that legally requires a degree, you thrive in a classroom setting, or you value the broader network and flexibility a four-year experience can build. Trade school tends to suit you better if you’d rather learn by doing than by lecture, you want to avoid debt and start earning quickly, or you like the idea of a skill that’s always in demand and hard to automate. Plenty of people also do both — a trade now, a degree later (often paid for by the trade income), or a two-year associate degree as a middle path.

    Verdict: Which Should You Choose?

    • Choose college if your target career requires a degree, you’re likely to land in a high-paying field (engineering, computer science, nursing, finance), or the non-financial parts of the experience genuinely matter to you.
    • Choose trade school or an apprenticeship if you want to start earning sooner, avoid the average $40,467 in debt, and work in a field with strong hands-on demand and a shrinking pool of skilled workers.
    • For most people without a specific degree-requiring career in mind, the trades are the financially safer bet in 2026 — faster paycheck, little to no debt, and a labor market that’s short on workers rather than short on jobs. College remains the better call, but only when it’s aimed at a career that actually needs one.

    Neither path is universally “right” — the honest answer depends on what you want to do for a living, not which option sounds more prestigious.

    If You’re a Student Actually Weighing This Decision

    If you’re the one making this call right now rather than just reading about it in the abstract, a few related things are worth having on your radar before you commit to either path. Once the paychecks start — whether from a trade or a degree job — where that money goes matters almost as much as how much of it there is; our Roth IRA vs Traditional IRA comparison is a good next read for getting retirement savings started early, which compounds more the sooner you begin. It’s also worth knowing that the same labor shortage pulling students toward the trades is showing up in immigration policy too — see our H-2B Visa Increase 2026 coverage for how the government is widening the cap specifically to plug gaps in construction and other hands-on trades. And if location factors into your decision at all — where the jobs, pay and growth actually are — our Tech Hub Rankings 2026 breaks down which U.S. regions are seeing the strongest job and wage growth across both tech and skilled-labor markets.

    Frequently Asked Questions

    Is trade school cheaper than college in 2026? Yes, significantly. The average trade program costs about $15,070 a year and takes one to two years, versus $113,396–$243,696 total for a four-year degree. Paid apprenticeships can bring the out-of-pocket cost to essentially $0.

    Do trade school graduates make less than college graduates? Not by as much as most people think. Median trade pay ($53,750–$63,800) is close to the average new college grad’s starting salary ($69,600), and many tradespeople who run their own business or work overtime/union jobs earn well into six figures.

    Is it harder to get a job with a trade certificate or a college degree right now? Currently, it’s easier in the trades. Young college graduates face a 5.3% unemployment rate versus a 4.3% national average, while skilled trades face a labor shortage, not a hiring slowdown.

    What is an apprenticeship, and how is it different from trade school? Trade school is classroom-based training you typically pay for. An apprenticeship is paid, on-the-job training run by an employer or union — you earn a wage (starting around 40–50% of full pay) while you learn, with no tuition bill.

    Is a college degree still worth it? Often, yes — especially for careers that legally require one (medicine, law, teaching, engineering) or fields with strong average pay. The math in this article shows the break-even point is further out than people assume, so it’s worth being specific about your intended career before committing to four years and the debt that comes with it.

    Disclaimer

    This article is a neutral, fact-based comparison for general information and uses national U.S. averages, which vary widely by state, school, trade and individual circumstances. The 6-year financial model above is a simplified illustration, not a guarantee or personalized advice. Costs, salaries and job-market conditions change — always check official sources and consider speaking with a school counselor or financial advisor before making a decision, and do your own research for your specific situation.

  • Rent vs Buy in 2026: Which Actually Builds More Wealth?

    Rent vs Buy in 2026: Which Actually Builds More Wealth?

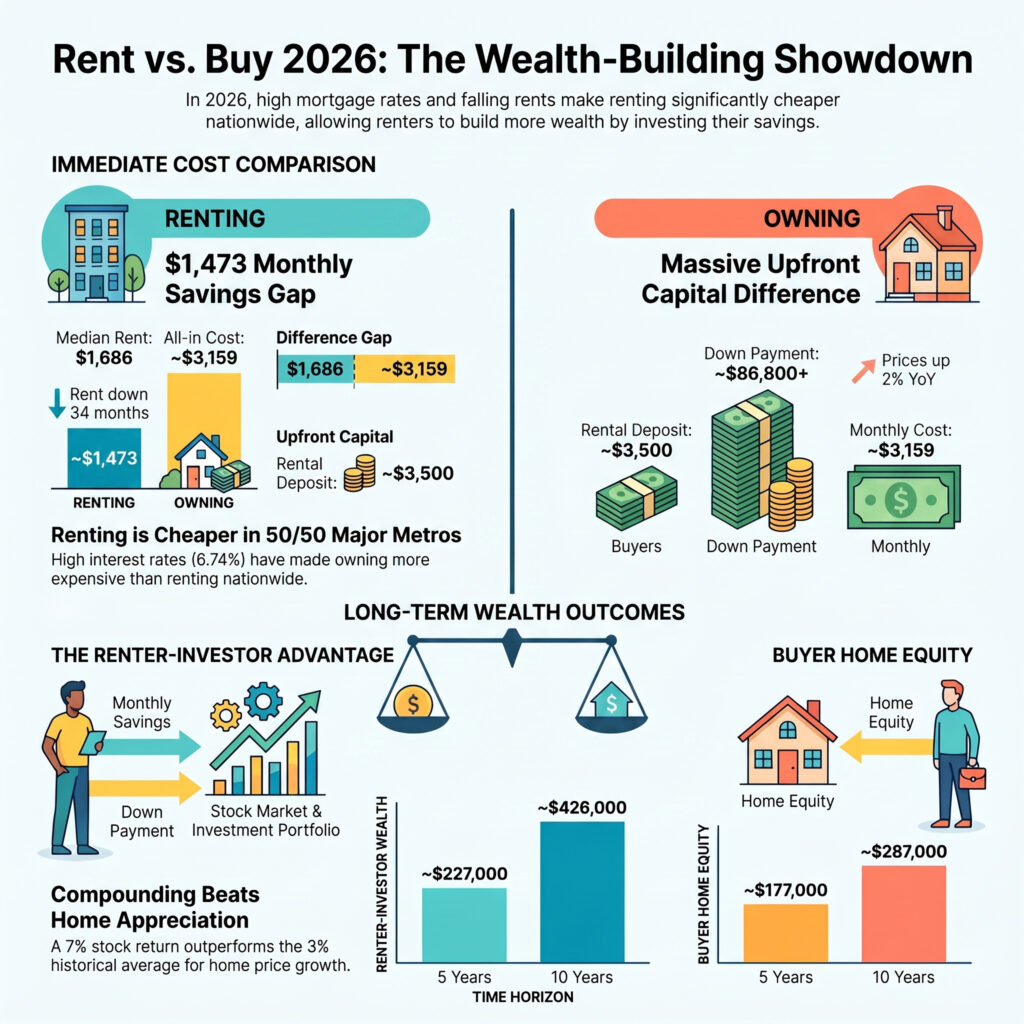
    Rent vs buy in 2026 isn’t the same question it was a few years ago — mortgage rates jumped again this week as Middle East tensions escalated, pushing the average 30-year fixed rate to 6.74%, while median rent has now fallen for 34 straight months. That combination has quietly flipped the math in most U.S. metros: renting now costs less than buying every month in all 50 major markets. But “cheaper right now” and “better long-term decision” are two different questions — so this comparison runs the actual numbers on both, including a calculation almost no one shows you: what happens if a renter invests the difference instead.

    Rent vs Buy in 2026: Quick Answer

    • If you need to move within 5 years, or your local price-to-rent ratio is high → renting wins. Transaction costs and today’s rate environment make buying-and-selling too expensive to pay off that fast.
    • If you’re staying 10+ years, want payment stability, and value forced savings over investing discipline → buying wins, mainly through the certainty of a fixed payment while rents keep rising.
    • For most people weighing this purely as a wealth-building decision today → renting and investing the difference comes out ahead over 5–10 years under current rates, unless home prices rise faster than they have recently or you can put well over 20% down.

    Renting vs Buying: At a Glance (2026 U.S. National Averages)

    FactorRentingBuying
    Median monthly cost$1,686/month rent~$3,159/month all-in (P&I, tax, insurance, upkeep)
    Upfront cash neededSecurity deposit (~1 month’s rent)~$86,800 (20% down on median home) + ~2–5% closing costs
    Current 30-year mortgage rateN/A6.74%
    Median home price (existing)N/A$434,100
    Monthly cost trendDown 34 straight months (YoY)Up 2% YoY, near a 37th straight month of increases
    Price-to-rent ratio (national)—~134 (long-run average is ~102 — homes are historically expensive relative to rent)
    Who “wins” on cash flowRenters, in all 50 largest metros—
    Who builds forced equity—Buyers, through principal paydown + appreciation

    Upfront Costs: The Bigger Gap Than People Expect

    The down payment is the most visible hurdle, but it’s not the whole story. On a median-priced $434,100 home with 20% down, a buyer needs roughly $86,800 just to reach the closing table — before another 2–5% in closing costs (title, inspection, lender fees), which adds $8,700–$21,700 more. That’s a real up-front cash requirement in the ballpark of $95,000–$108,000.

    A renter’s upfront cost, by comparison, is typically a security deposit and first month’s rent — often under $3,500 at the median. That gap matters for the calculation below, because every dollar a renter doesn’t put down is a dollar that can go somewhere else — including retirement accounts, where the choice between a Roth IRA and a Traditional IRA shapes how that money grows.

    Monthly Cost: Why Renting Currently Wins Everywhere

    At 6.74% on a 30-year fixed loan, the principal-and-interest payment alone on that $347,300 loan (after 20% down) runs about $2,250/month. Add property tax, homeowners insurance and routine maintenance, and all-in ownership cost lands closer to $3,159/month — nearly double the $1,686 national median rent.

    That gap is why, as of 2026, renting is the cheaper monthly option in every one of the 50 largest U.S. metros, by an average of roughly $920/month, ranging from a near-wash in Pittsburgh to well over $2,000/month in expensive coastal markets like San Jose. Two forces widened this gap recently: home prices have kept climbing (median existing-home price is up 2% year-over-year, the 37th straight monthly increase), while rents have actually been falling for almost three years as new apartment supply caught up with demand.

    The Original Angle: What If a Renter Invests the Difference?

    Here’s the calculation most rent-vs-buy articles skip. Comparing monthly cost alone isn’t fair — a buyer’s payment partly builds equity, while a renter who pays less each month could be investing the gap instead.

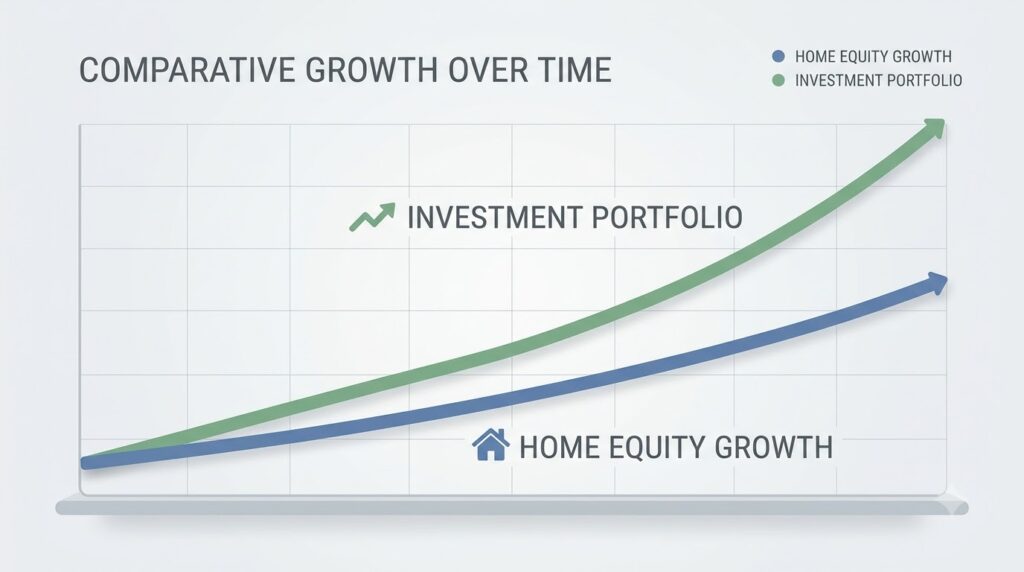
    Chart comparing home equity growth to investment growth over 10 years

    So we ran both paths side by side, starting from the same $434,100 home, the same $86,800 down payment, and the 6.74% rate above.

    The setup:

    • Buyer puts $86,800 down, pays the mortgage, and gains equity through principal paydown plus home-price appreciation (modeled at a 3% annual rate, near the recent historical average).
    • Renter keeps that $86,800 invested instead of using it as a down payment, and also invests the $1,473/month they save by renting ($3,159 owning cost − $1,686 rent), assuming a 7% average annual return — a conservative long-run assumption for a diversified stock portfolio.
    5 Years10 Years
    Buyer’s home equity (value minus remaining loan)~$177,000~$287,000
    Renter’s invested portfolio (down payment + monthly savings, invested)~$227,000~$426,000
    Renting-and-investing advantage~$50,000~$139,000

    Under these assumptions, renting and investing the difference comes out ahead at both the 5-year and 10-year mark — and the gap widens over time, because compounding favors the investment account more than a fixed-rate mortgage rewards the buyer. This isn’t a universal law: raise home appreciation to 5–6% a year (closer to the boom years of 2020–2022), lower the assumed stock return to 4–5%, or hold the property for 20-plus years, and the buyer’s side closes the gap or pulls ahead. The math also ignores rent increases over time (real-world rent growth would shrink the renter’s monthly investment each year), the mortgage interest deduction, and the roughly 6–8% selling costs a homeowner would pay to cash out equity — all of which push the real-world numbers around a bit, but rarely enough to erase a six-figure gap at today’s 6.74% rate.

    Flexibility, Risk and the Non-Financial Side

    Money isn’t the only factor, and a fair comparison has to stay neutral about the rest of the picture.

    Renting wins on flexibility. Lease terms are typically 12 months, moving for a job or relationship change is far cheaper, and a renter isn’t exposed to a 10.3-month supply overhang or the risk of buying right before a local price correction.

    Buying wins on payment certainty and forced discipline. A fixed-rate mortgage payment doesn’t rise with inflation the way rent can (even though rent is currently falling nationally, it has historically trended up over full cycles), and many buyers who wouldn’t otherwise invest consistently end up building wealth simply because their mortgage payment forces monthly savings.

    Buying also carries risks renting doesn’t: maintenance costs that don’t show up in a mortgage quote, property tax increases, the chance a local market underperforms the 3% appreciation assumed above, and the illiquidity of needing months to sell if plans change.

    Verdict: Which Should You Choose?

    • Choose renting if you might move within 5 years, you’d rather not tie up six figures in a down payment, or your local price-to-rent ratio is stretched — and especially if you’re disciplined enough to actually invest the monthly savings rather than spend them.
    • Choose buying if you’re settled for 10+ years, you want a fixed payment that insulates you from future rent increases, or the non-financial value of owning (stability, control over the space, no landlord) outweighs the financial gap shown above.
    • For most people focused purely on building wealth over the next decade, the math at today’s 6.74% rate favors renting and investing the difference — but that edge shrinks the longer you stay put, the more home prices in your specific market outperform the 3% national assumption, and the more disciplined a buyer is about paying down the mortgage versus a renter is about actually investing. Run your own local numbers before deciding.

    Frequently Asked Questions

    Is it cheaper to rent or buy in 2026? On a monthly basis, renting is cheaper in all 50 of the largest U.S. metros in 2026, by an average of about $920/month, because mortgage rates (6.74%) and home prices (up 2% year-over-year) have risen while median rent has fallen for 34 consecutive months.

    What is the break-even point for buying a home? Most analysts put the break-even point — where owning starts to beat renting once you account for transaction costs — at roughly 5 to 7 years under typical appreciation assumptions, and potentially 10+ years if home-price growth stays as slow as it’s been recently.

    Is renting and investing the difference actually better than buying? Under 2026’s rates and prices, a simple model shows a renter who invests their down payment and monthly savings coming out roughly $50,000–$139,000 ahead of a buyer’s home equity after 5–10 years — but this depends heavily on assumed investment returns and home appreciation, and doesn’t account for the non-financial value of owning.

    How much down payment do you need to buy a median-priced home in 2026? About $86,800 for a 20% down payment on the $434,100 median existing-home price, plus another 2–5% (roughly $8,700–$21,700) in closing costs.

    Why did mortgage rates go up recently? Rates rose in early September 2026 alongside renewed escalation in Middle East tensions, pushing the average 30-year fixed rate up to 6.74% — a reminder that mortgage rates react to global events, not just domestic housing data.

    Disclaimer

    This comparison uses national U.S. averages and a simplified financial model (fixed appreciation and investment-return assumptions) for illustration only — it is not personalized financial advice. Local prices, rents, tax rules and market conditions vary widely, and real investment returns are never guaranteed. Do your own research, run your own numbers for your market, and consider speaking with a licensed financial or mortgage professional before making a decision.

  • Roth IRA vs Traditional IRA: Which Retirement Account Is Better in 2026?

    Roth IRA vs Traditional IRA is one of the most common money questions in America — and the honest answer is that neither is universally “better.” They hold the same investments and share the same yearly limit; the real difference is when you pay tax: now, or in retirement. This neutral, up-to-date comparison breaks down the 2026 rules, the tax trade-off, income limits and withdrawal differences — and gives you a clear, situation-based way to decide instead of a vague “it depends.”

    Roth IRA vs Traditional IRA: Quick Answer

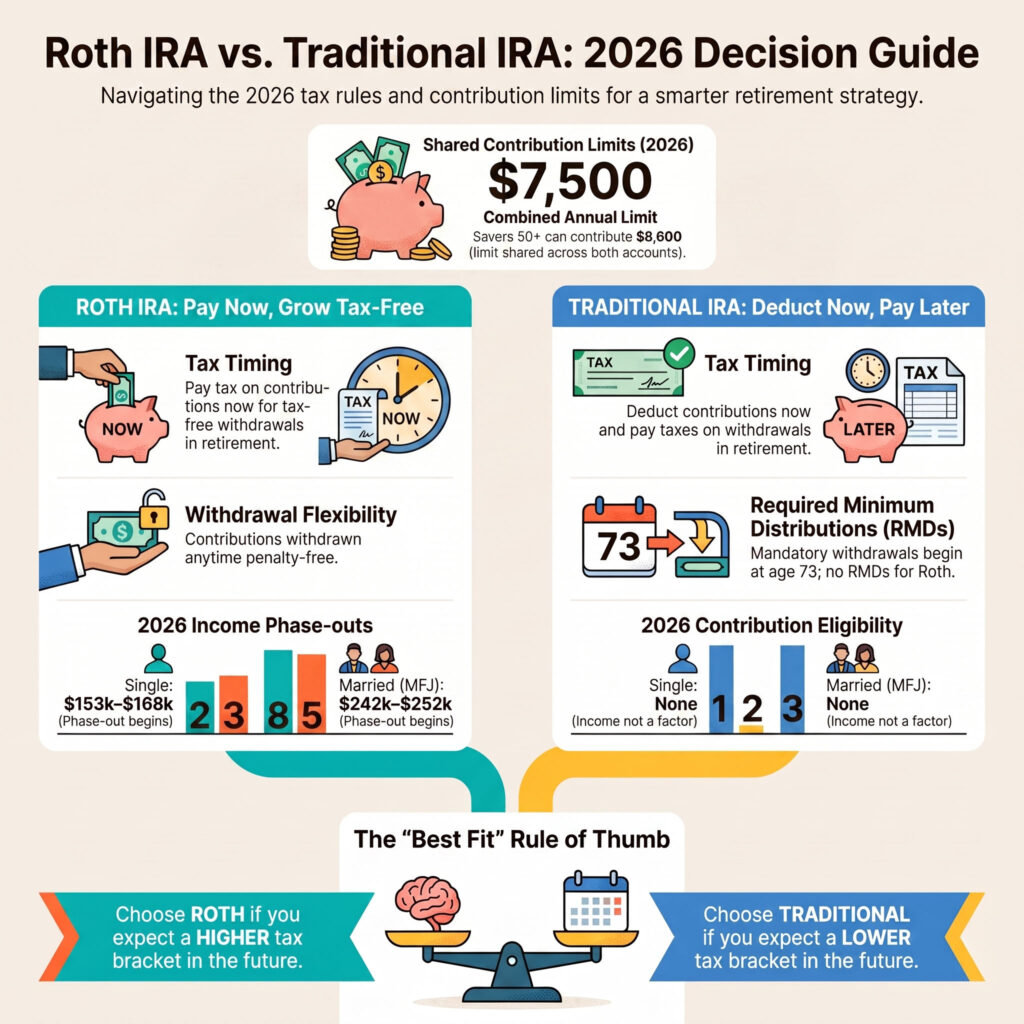
    Roth IRA vs Traditional IRA 2026 rules and limits infographic

    If you expect to be in a higher tax bracket later (early career, lower income now, decades to grow), a Roth IRA usually wins — you pay tax now and withdraw tax-free. If you’re in a high-earning year now and want to lower this year’s taxable income (and expect a lower bracket in retirement), a Traditional IRA often makes more sense — you deduct now and pay tax later. For most people the deciding question is simple: do you think your tax rate will be higher or lower when you retire than it is today? Higher later → Roth; lower later → Traditional.

    Roth IRA vs Traditional IRA at a Glance (US, 2026)

    Roth IRATraditional IRA
    Tax on contributionsAfter-tax (no deduction)Pre-tax (may be deductible)
    Tax on qualified withdrawalsTax-freeTaxed as ordinary income
    2026 contribution limit$7,500 (under 50) / $8,600 (50+)$7,500 (under 50) / $8,600 (50+)
    Income limit to contributeYes — phases out at high incomeNo limit to contribute
    Deduction income limitN/AYes, if covered by a work plan
    Required withdrawals (RMDs)None during owner’s lifetimeYes, starting at age 73
    Early withdrawal of contributionsAnytime, penalty-freeGenerally taxed + 10% penalty
    Best fitHigher tax bracket expected laterLower tax bracket expected later

    (Figures are 2026 US IRS limits and can change yearly — always check IRS.gov before contributing.)

    How They Work: The Core Tax Trade-Off

    The entire Roth IRA vs Traditional IRA decision comes down to one thing: when the government takes its cut.

    With a Traditional IRA, you contribute pre-tax money. If you qualify for the deduction, it lowers your taxable income this year — a real, immediate saving. Your money then grows tax-deferred, and you pay ordinary income tax on every dollar you withdraw in retirement.

    With a Roth IRA, you contribute money you’ve already paid tax on. There’s no deduction today, but the account grows tax-free and — as long as you follow the rules — you pay zero tax on qualified withdrawals in retirement, including all the investment growth.

    So it’s not “free money vs taxed money.” Both are taxed once. The only question is whether you’d rather pay that tax now (Roth) or later (Traditional).

    2026 Contribution Limits

    For 2026, the IRS set the combined IRA contribution limit at $7,500 for savers under 50, and $8,600 for those 50 and older (the extra $1,100 is the “catch-up” contribution). Importantly, this limit is shared across both account types: you can split it between a Roth and a Traditional IRA, but the total across both can’t exceed the annual cap.

    You have until the tax-filing deadline to contribute for a given year — so 2026 contributions can be made through April 15, 2027.

    Income Limits and Eligibility

    This is where the two accounts diverge sharply, and it’s often the deciding factor before personal preference even enters.

    Roth IRA has income limits to contribute. For 2026, the ability to contribute directly phases out between a modified adjusted gross income (MAGI) of $153,000–$168,000 for single filers, and $242,000–$252,000 for married couples filing jointly. Earn above the top of your range and you can’t contribute directly at all (though a “backdoor Roth” conversion is a legal workaround many higher earners use).

    Traditional IRA has no income limit to contribute — anyone with earned income can put money in. The catch is deductibility: if you (or your spouse) are covered by a workplace retirement plan like a 401(k), your deduction phases out at $81,000–$91,000 (single) and $129,000–$149,000 (married filing jointly, contributor covered). Above that, you can still contribute — you just won’t get the tax break, which removes much of the Traditional IRA’s appeal.

    The honest takeaway: high earners are often pushed toward one option by the rules, not by choice.

    Withdrawals and Flexibility

    A big practical difference shows up when you need access to your money.

    With a Roth IRA, you can withdraw your contributions (not earnings) at any time, tax- and penalty-free, because you already paid tax on them. That flexibility makes a Roth double as a soft emergency backstop. Earnings, however, generally need the account to be five years old and you to be 59½ to come out tax-free.

    With a Traditional IRA, early withdrawals before 59½ are generally hit with ordinary income tax plus a 10% penalty, with limited exceptions. There’s far less flexibility to tap the money early without cost.

    Required Minimum Distributions (RMDs)

    Here’s a difference that matters most for retirees and estate planning. A Traditional IRA forces you to start withdrawing — and paying tax — via Required Minimum Distributions beginning at age 73, whether you need the money or not.

    A Roth IRA has no RMDs during the original owner’s lifetime. You can leave it untouched to grow tax-free for as long as you like, which makes it a powerful tool for passing wealth to heirs. For anyone who wants control over when they draw down (or wants to leave the account alone entirely), the Roth’s flexibility is a clear edge.

    The Original Angle: The “Tax Rate Break-Even” Test

    Most Roth IRA vs Traditional IRA articles stop at “it depends on your tax bracket.” Here’s a way to actually pressure-test that for yourself — a simple framework you won’t find on most comparison pages.

    Roth IRA vs Traditional IRA tax timing decision illustration

    The core math nobody spells out: if your tax rate is exactly the same now and in retirement, a Roth and a Traditional IRA produce the identical after-tax result. The dollar amounts look different along the way, but the ending spendable money is the same. Here’s a simplified illustration (ignoring income limits, at a flat 22% rate):

    Roth IRATraditional IRA
    You want to invest$7,500$7,500
    Tax paid now (22%)$1,650 (paid upfront)$0 (deducted)
    Amount actually invested$7,500$7,500
    Grows to (say, 3x over time)$22,500$22,500
    Tax paid at withdrawal (22%)$0$4,950
    After-tax money in hand$22,500$17,550

    At first glance Roth looks like a runaway winner — but that’s because the Traditional saver also got a $1,650 tax deduction upfront that isn’t shown here. Invest that refund too, and the two even out at equal tax rates. That’s the real insight: the winner is decided almost entirely by whether your tax rate changes.

    The practical rule this gives you:

    • Expect a higher tax rate in retirement than today? Roth wins — lock in today’s lower rate.
    • Expect a lower tax rate in retirement? Traditional wins — deduct at today’s high rate, pay less later.
    • Not sure? Many savers split contributions across both to hedge — “tax diversification” — so they have taxable and tax-free buckets to draw from later.

    The number to figure out isn’t a return rate — it’s your future tax bracket relative to today’s. That single guess drives the whole decision.

    Verdict: Which Should You Choose?

    No fence-sitting — here’s the situation-based call, backed by everything above.

    • Choose a Roth IRA if you’re early in your career, in a relatively low tax bracket now, expect to earn (and be taxed) more later, want withdrawal flexibility, or want to avoid forced withdrawals in retirement. It’s the stronger pick for younger savers and anyone betting tax rates rise.
    • Choose a Traditional IRA if you’re a high earner today wanting to cut this year’s taxable income, expect a lower bracket in retirement, and value the immediate deduction — assuming your income still qualifies you to deduct.
    • For most people, the deciding factor is the tax-rate question, not the account itself: higher rate later points to Roth, lower rate later points to Traditional, and genuine uncertainty is a fair reason to split between both. If income limits make the choice for you, follow the rules first — then optimise.

    Whichever you choose, the biggest win is simply contributing consistently and early; the account type fine-tunes the outcome, but time in the market does the heavy lifting.

    Frequently Asked Questions

    Is a Roth IRA or Traditional IRA better in 2026? Neither is universally better. A Roth IRA is generally better if you expect a higher tax bracket in retirement, since withdrawals are tax-free. A Traditional IRA is often better if you want to lower your taxable income now and expect a lower bracket later. The best pick depends on your current versus future tax rate.

    What is the 2026 IRA contribution limit? For 2026, you can contribute up to $7,500 if you’re under 50, or $8,600 if you’re 50 or older. This limit is shared across both Roth and Traditional IRAs combined — not per account.

    Can I contribute to both a Roth IRA and a Traditional IRA? Yes, but your total contributions across both can’t exceed the annual limit ($7,500, or $8,600 if 50+). Many savers split contributions between the two for tax diversification.

    Who can’t contribute to a Roth IRA? High earners above the income phase-out — for 2026, a MAGI above $168,000 (single) or $252,000 (married filing jointly) blocks direct Roth contributions. A “backdoor Roth” conversion is a common legal workaround.

    Does a Traditional IRA have required withdrawals? Yes. Traditional IRAs require minimum distributions (RMDs) starting at age 73. Roth IRAs have no required withdrawals during the original owner’s lifetime, which is one of their key advantages.

    Disclaimer

    This article is a neutral, fact-based comparison for general information only and is not financial, tax or investment advice. IRA rules, contribution limits and income thresholds change yearly and depend on your personal situation — the figures here are 2026 US IRS figures and may change. Always check IRS.gov and consult a qualified financial or tax professional before making retirement account decisions, and do your own research for your circumstances.