
Rent vs buy in 2026 isn’t the same question it was a few years ago — mortgage rates jumped again this week as Middle East tensions escalated, pushing the average 30-year fixed rate to 6.74%, while median rent has now fallen for 34 straight months. That combination has quietly flipped the math in most U.S. metros: renting now costs less than buying every month in all 50 major markets. But “cheaper right now” and “better long-term decision” are two different questions — so this comparison runs the actual numbers on both, including a calculation almost no one shows you: what happens if a renter invests the difference instead.
Rent vs Buy in 2026: Quick Answer
- If you need to move within 5 years, or your local price-to-rent ratio is high → renting wins. Transaction costs and today’s rate environment make buying-and-selling too expensive to pay off that fast.
- If you’re staying 10+ years, want payment stability, and value forced savings over investing discipline → buying wins, mainly through the certainty of a fixed payment while rents keep rising.
- For most people weighing this purely as a wealth-building decision today → renting and investing the difference comes out ahead over 5–10 years under current rates, unless home prices rise faster than they have recently or you can put well over 20% down.
Renting vs Buying: At a Glance (2026 U.S. National Averages)
| Factor | Renting | Buying |
|---|---|---|
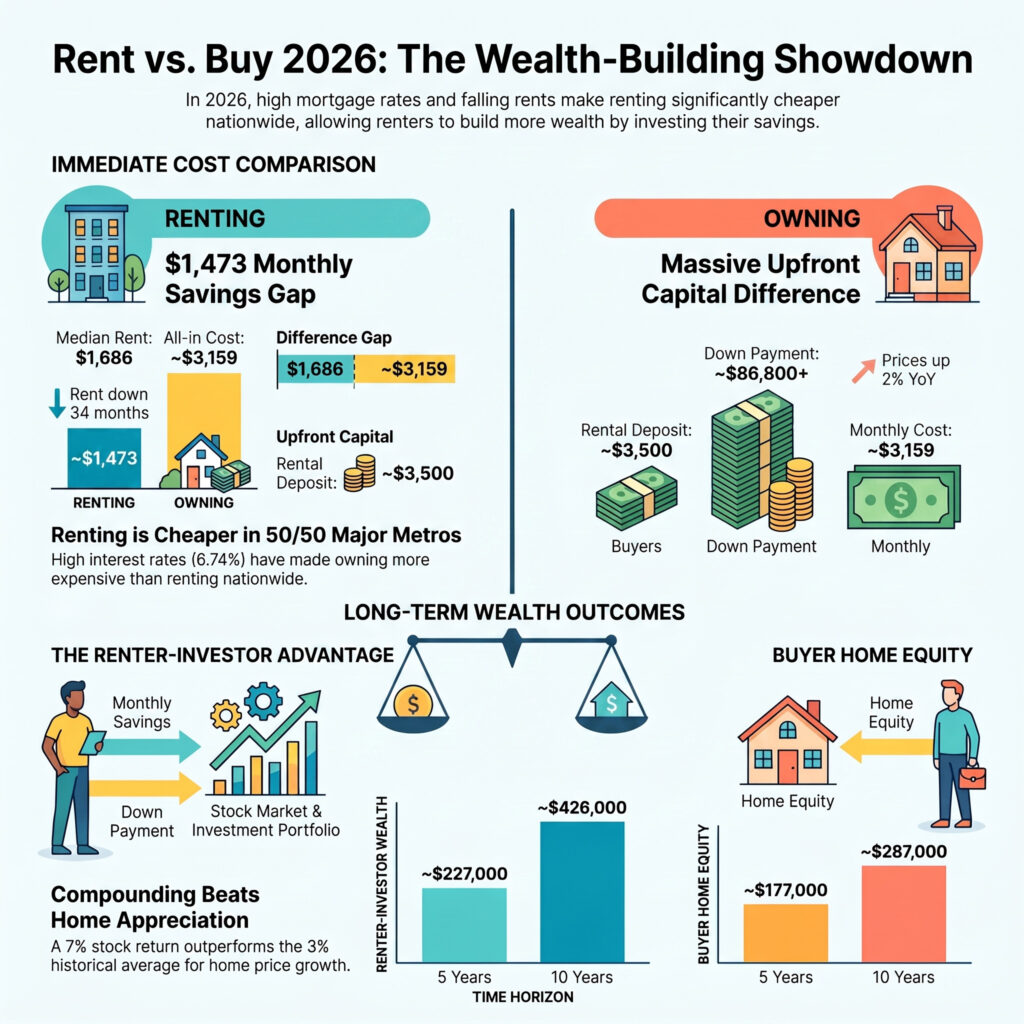
| Median monthly cost | $1,686/month rent | ~$3,159/month all-in (P&I, tax, insurance, upkeep) |
| Upfront cash needed | Security deposit (~1 month’s rent) | ~$86,800 (20% down on median home) + ~2–5% closing costs |
| Current 30-year mortgage rate | N/A | 6.74% |
| Median home price (existing) | N/A | $434,100 |
| Monthly cost trend | Down 34 straight months (YoY) | Up 2% YoY, near a 37th straight month of increases |
| Price-to-rent ratio (national) | — | ~134 (long-run average is ~102 — homes are historically expensive relative to rent) |
| Who “wins” on cash flow | Renters, in all 50 largest metros | — |
| Who builds forced equity | — | Buyers, through principal paydown + appreciation |
Upfront Costs: The Bigger Gap Than People Expect
The down payment is the most visible hurdle, but it’s not the whole story. On a median-priced $434,100 home with 20% down, a buyer needs roughly $86,800 just to reach the closing table — before another 2–5% in closing costs (title, inspection, lender fees), which adds $8,700–$21,700 more. That’s a real up-front cash requirement in the ballpark of $95,000–$108,000.
A renter’s upfront cost, by comparison, is typically a security deposit and first month’s rent — often under $3,500 at the median. That gap matters for the calculation below, because every dollar a renter doesn’t put down is a dollar that can go somewhere else — including retirement accounts, where the choice between a Roth IRA and a Traditional IRA shapes how that money grows.
Monthly Cost: Why Renting Currently Wins Everywhere
At 6.74% on a 30-year fixed loan, the principal-and-interest payment alone on that $347,300 loan (after 20% down) runs about $2,250/month. Add property tax, homeowners insurance and routine maintenance, and all-in ownership cost lands closer to $3,159/month — nearly double the $1,686 national median rent.
That gap is why, as of 2026, renting is the cheaper monthly option in every one of the 50 largest U.S. metros, by an average of roughly $920/month, ranging from a near-wash in Pittsburgh to well over $2,000/month in expensive coastal markets like San Jose. Two forces widened this gap recently: home prices have kept climbing (median existing-home price is up 2% year-over-year, the 37th straight monthly increase), while rents have actually been falling for almost three years as new apartment supply caught up with demand.
The Original Angle: What If a Renter Invests the Difference?
Here’s the calculation most rent-vs-buy articles skip. Comparing monthly cost alone isn’t fair — a buyer’s payment partly builds equity, while a renter who pays less each month could be investing the gap instead.
So we ran both paths side by side, starting from the same $434,100 home, the same $86,800 down payment, and the 6.74% rate above.
The setup:
- Buyer puts $86,800 down, pays the mortgage, and gains equity through principal paydown plus home-price appreciation (modeled at a 3% annual rate, near the recent historical average).
- Renter keeps that $86,800 invested instead of using it as a down payment, and also invests the $1,473/month they save by renting ($3,159 owning cost − $1,686 rent), assuming a 7% average annual return — a conservative long-run assumption for a diversified stock portfolio.
| 5 Years | 10 Years | |
|---|---|---|
| Buyer’s home equity (value minus remaining loan) | ~$177,000 | ~$287,000 |
| Renter’s invested portfolio (down payment + monthly savings, invested) | ~$227,000 | ~$426,000 |
| Renting-and-investing advantage | ~$50,000 | ~$139,000 |
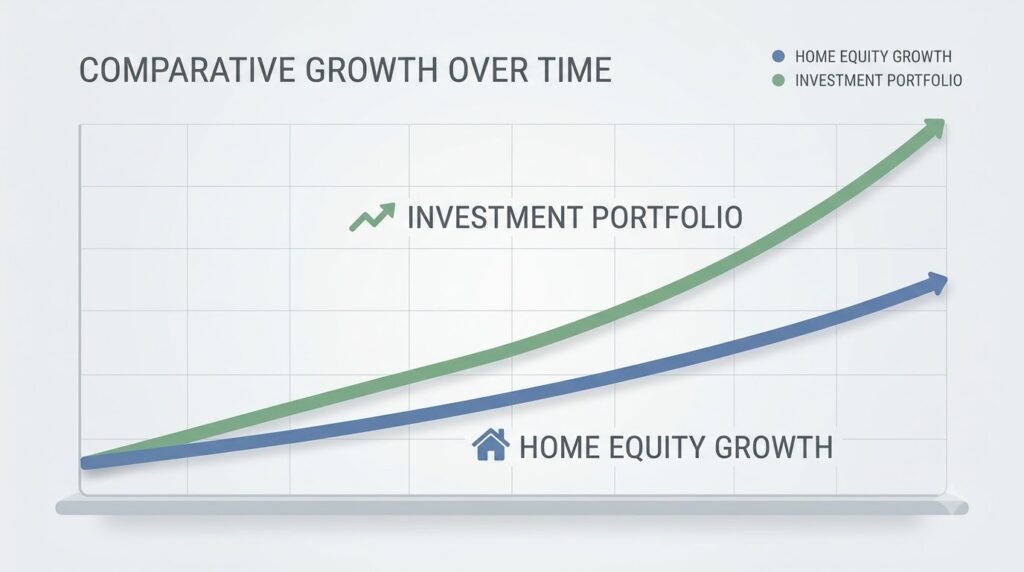
Under these assumptions, renting and investing the difference comes out ahead at both the 5-year and 10-year mark — and the gap widens over time, because compounding favors the investment account more than a fixed-rate mortgage rewards the buyer. This isn’t a universal law: raise home appreciation to 5–6% a year (closer to the boom years of 2020–2022), lower the assumed stock return to 4–5%, or hold the property for 20-plus years, and the buyer’s side closes the gap or pulls ahead. The math also ignores rent increases over time (real-world rent growth would shrink the renter’s monthly investment each year), the mortgage interest deduction, and the roughly 6–8% selling costs a homeowner would pay to cash out equity — all of which push the real-world numbers around a bit, but rarely enough to erase a six-figure gap at today’s 6.74% rate.
Flexibility, Risk and the Non-Financial Side
Money isn’t the only factor, and a fair comparison has to stay neutral about the rest of the picture.
Renting wins on flexibility. Lease terms are typically 12 months, moving for a job or relationship change is far cheaper, and a renter isn’t exposed to a 10.3-month supply overhang or the risk of buying right before a local price correction.
Buying wins on payment certainty and forced discipline. A fixed-rate mortgage payment doesn’t rise with inflation the way rent can (even though rent is currently falling nationally, it has historically trended up over full cycles), and many buyers who wouldn’t otherwise invest consistently end up building wealth simply because their mortgage payment forces monthly savings.
Buying also carries risks renting doesn’t: maintenance costs that don’t show up in a mortgage quote, property tax increases, the chance a local market underperforms the 3% appreciation assumed above, and the illiquidity of needing months to sell if plans change.
Verdict: Which Should You Choose?
- Choose renting if you might move within 5 years, you’d rather not tie up six figures in a down payment, or your local price-to-rent ratio is stretched — and especially if you’re disciplined enough to actually invest the monthly savings rather than spend them.
- Choose buying if you’re settled for 10+ years, you want a fixed payment that insulates you from future rent increases, or the non-financial value of owning (stability, control over the space, no landlord) outweighs the financial gap shown above.
- For most people focused purely on building wealth over the next decade, the math at today’s 6.74% rate favors renting and investing the difference — but that edge shrinks the longer you stay put, the more home prices in your specific market outperform the 3% national assumption, and the more disciplined a buyer is about paying down the mortgage versus a renter is about actually investing. Run your own local numbers before deciding.
Frequently Asked Questions
Is it cheaper to rent or buy in 2026? On a monthly basis, renting is cheaper in all 50 of the largest U.S. metros in 2026, by an average of about $920/month, because mortgage rates (6.74%) and home prices (up 2% year-over-year) have risen while median rent has fallen for 34 consecutive months.
What is the break-even point for buying a home? Most analysts put the break-even point — where owning starts to beat renting once you account for transaction costs — at roughly 5 to 7 years under typical appreciation assumptions, and potentially 10+ years if home-price growth stays as slow as it’s been recently.
Is renting and investing the difference actually better than buying? Under 2026’s rates and prices, a simple model shows a renter who invests their down payment and monthly savings coming out roughly $50,000–$139,000 ahead of a buyer’s home equity after 5–10 years — but this depends heavily on assumed investment returns and home appreciation, and doesn’t account for the non-financial value of owning.
How much down payment do you need to buy a median-priced home in 2026? About $86,800 for a 20% down payment on the $434,100 median existing-home price, plus another 2–5% (roughly $8,700–$21,700) in closing costs.
Why did mortgage rates go up recently? Rates rose in early September 2026 alongside renewed escalation in Middle East tensions, pushing the average 30-year fixed rate up to 6.74% — a reminder that mortgage rates react to global events, not just domestic housing data.
Disclaimer
This comparison uses national U.S. averages and a simplified financial model (fixed appreciation and investment-return assumptions) for illustration only — it is not personalized financial advice. Local prices, rents, tax rules and market conditions vary widely, and real investment returns are never guaranteed. Do your own research, run your own numbers for your market, and consider speaking with a licensed financial or mortgage professional before making a decision.